There are several popular monitoring tools available for Node.js applications that can help you track and analyze the performance, health, and behavior of your application. These tools provide insights into various metrics, including CPU and memory usage, response times, error rates, and more. Here are a few commonly used Node.js application monitoring tools:
-
New Relic: New Relic is a comprehensive application monitoring tool that supports Node.js and provides real-time insights into your application’s performance. It offers features such as code-level diagnostics, transaction tracing, and database monitoring. New Relic provides a dashboard with detailed metrics, alerts, and performance analysis to help optimize your application.
-
Datadog: Datadog is a popular monitoring and analytics platform that supports Node.js applications. It provides real-time visibility into your application’s performance and allows you to monitor metrics, logs, and traces. Datadog offers customizable dashboards, alerting capabilities, and integrations with various data sources for in-depth monitoring and analysis.
-
Prometheus: Prometheus is an open-source monitoring and alerting toolkit that includes support for Node.js applications. It collects and stores time-series data and offers a powerful query language to analyze metrics. Prometheus can be integrated with Grafana, a visualization tool, to create custom dashboards and alerts based on your application’s metrics.
-
AppDynamics: AppDynamics is an application performance monitoring platform that supports Node.js applications. It provides end-to-end visibility into your application’s performance, including user experience, code-level diagnostics, and infrastructure monitoring. AppDynamics offers automatic baselining, anomaly detection, and powerful analytics for troubleshooting and optimizing your application.
-
PM2: PM2 is a process manager for Node.js applications that also includes monitoring capabilities. It provides an easy-to-use command-line interface for managing and monitoring your Node.js processes. PM2 can monitor CPU usage, memory usage, and other system metrics, and it also offers features like log management, process auto-restart, and clustering.
These are just a few examples of Node.js application monitoring tools available in the market. Each tool has its own set of features, capabilities, and pricing models. It’s recommended to evaluate the specific needs of your application and consider factors such as ease of integration, scalability, and cost before choosing a monitoring tool for your Node.js application.
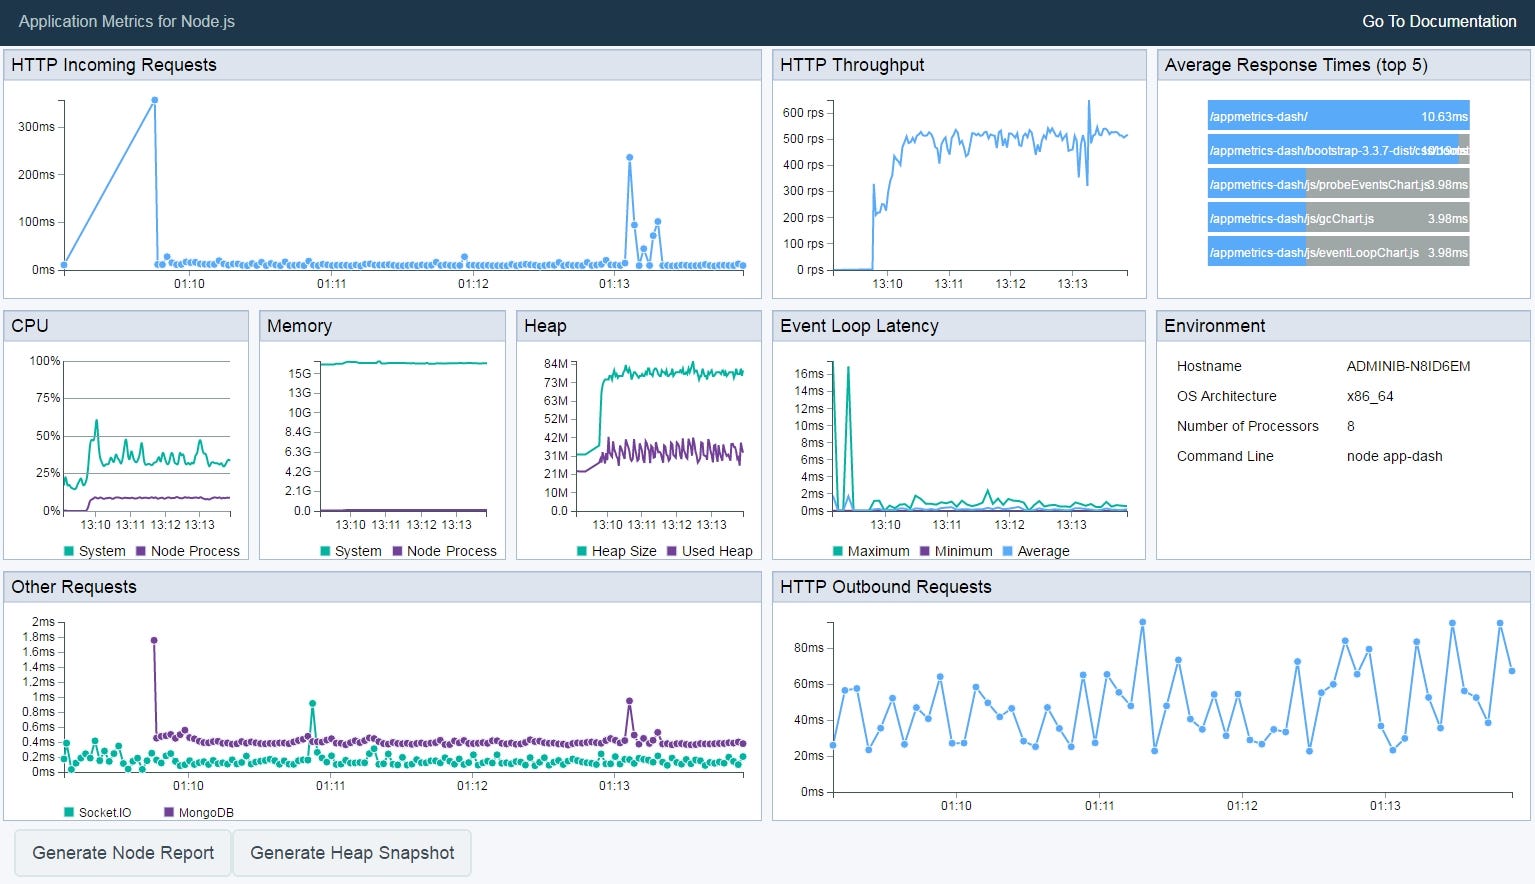
Node Application Metrics Dashboard (app metrics-dash) provides a very easy-to-use web based dashboard to show the performance metrics of your running Node.js application.
If you want to add the dashboard to all HTTP servers created by your application then simply add: This is what you need to run this tool on
http://localhost:PORT/appmetrics-dash
// Before all other ‘require’ statements:
require(‘appmetrics-dash’).attach();to the very top of your main JavaScript source file or there are other ways also like you can use preloading:
$ node --require appmetrics-dash/attach app.jsor in Node.js from versions 8.0.0 and 6.12.0 onwards, use the NODE_OPTIONS environment variable:
$ export NODE_OPTIONS="--require appmetrics-dash/attach"If you want to add the dashboard to one specific HTTP server then use:
 var dash = require('appmetrics-dash');
    // Other 'require' statements here
    // Create HTTP server 'myHttpServer' here
dash.monitor({server: myHttpServer});
If you are not creating an HTTP server then use:
require('appmetrics-dash').monitor();or run your program with
$ node --require appmetrics-dash/monitor app.jsor via the NODE_OPTIONS environment variable:
$ export NODE_OPTIONS="--require appmetrics-dash/monitor"This creates a new server for the dashboard on port 3001 by default. The path defaults to /appmetrics-dash. E.g. http://localhost:3001/appmetrics-dash
The data available on the dashboard is as follows:
-
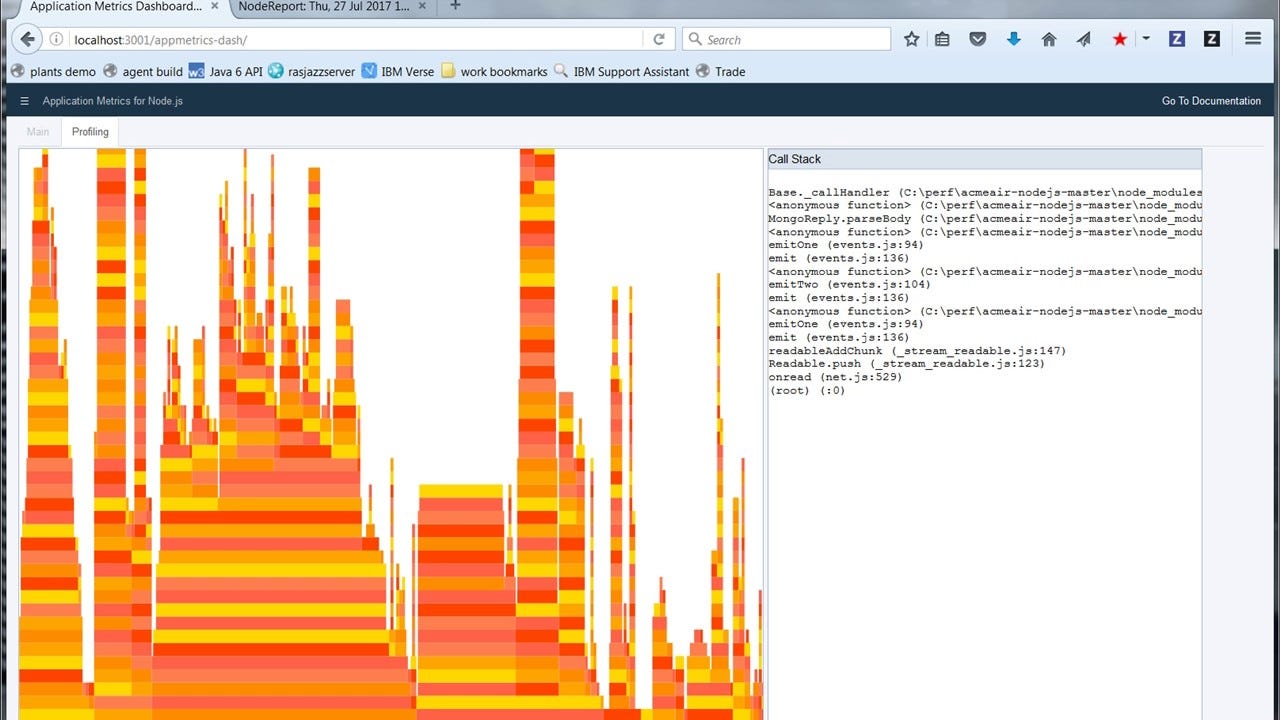
CPU Profiling (via a separate tab)
-
HTTP Incoming Requests
-
HTTP Throughput
-
Average Reponse Times (top 5)
-
CPU
-
Memory
-
Heap
-
Event Loop Times
-
Environment
-
Other Requests
-
HTTP Outbound Requests
As well as displaying data, it also provides the ability to generate both Node Report and Heap Snapshots directly from the dashboard. The Node Report will display in a new tab in the browser whilst the Heap Snapshot will be written to disk for loading into the Chrome DevTools for analysis. These can both be triggered from the options menu in the top left of the screen
The dashboard uses Node Application Metrics to monitor the application.
Installation
npm install appmetrics-dashPerformance overhead
Our testing has shown that the performance overhead in terms of processing is minimal, adding less than 0.5 % to the CPU usage of your application. The additional memory required is around 30 MB to gather information about your system and application which is then visualized in the dashboard.
We gathered this information by monitoring the sample application Acme Air. We used MongoDB as our datastore and used JMeter to drive load though the program. We have performed this testing with Node.js version 6.10.3
API Documentation
attach(options)
- options Options are the same as for dash.monitor().
Auto-attach to all http servers created after this call, calling dash.monitor(options) for every server.
Simple example using attach
    var dash = require('appmetrics-dash');
    dash.attach();

    var http = require('http');

    const port = 3000;

    const requestHandler = (request, response) => {
      response.end('Hello')
    }

    const server = http.createServer(requestHandler);

    server.listen(port, (err) => {
      if (err) {
        return console.log('An error occurred', err)
      }
      console.log(`Server is listening on ${port}`)
    });
monitor(options)
-
options.url Path to serve dashboard from. Optional, defaults to ‘/appmetrics-dash’.
-
options.console Some messages are printed to the console using console.log() and console.error(). Optional, defaults to the global console object.
-
options.server An instance of a node http server to serve the dashboard from. Optional, default is to create a server (see port and host).
-
options.port 0 Port to listen on if creating a server. Optional, unused if server option is used.
-
options.host Host to listen on if creating a server. Optional, unused if server option is used.
-
options.appmetrics An instance of require(‘appmetrics’) can be injected if the application wants to use appmetrics, since it is a singleton module and only one can be present in an application. Optional, defaults to the appmetrics dependency of this module.
-
options.node-report An instance of require(‘node-report’) can be injected if the application wants to use node-report, since it is a singleton module and only one can be present in an application. Optional, defaults to the node-report dependency of this module.
-
options.title Title for the dashboard.
-
options.docs URL link to accompanying documentation.
-
options.middleware Pass in middleware function to be used by server.
Conclusion :
User this tool to check performance of APIs locally before sending application to production. It is best tool available in Industry later you can use rewrelic and keymatrics.